
The attempt to apply whichever argument, discussed around the world, to the Italian (economic) reality produces, as usual, funny effects – maybe even because real life has turned to a “reality” show.
Take for example the idea – ridiculous in my view – that the current crisis is the result of a surplus of market, a flood of capitalistic-animal spirits, an excess of liberalizations & deregulations that has loosened state’s hold on society. This retreat of the state – the narrative goes – had perverse effects on social welfare and economic performance: macroeconomic instability, growing inequality, structural unemployment, financial intemperance, etc. A quick look to available evidence immediately shows, how we shall see in depth later, that all over the more developed world there is no such a thing as a decreasing trend in government size. Measuring government size with the ratio of aggregate public spending to Gdp and taking a targeted but explicative sample of developed countries (see below), we find that the median value was 43.8 per cent in 1980, 46.1 % in 1991, 46.3% in 2012.
But what is funny in the Italian reality is that, even if the need and the scope for cutting inefficient public spending and lower marginal rates and fiscal wedge are for a long time recognized and largely shared among political parties and by public opinion, government size is today around 50 percent, the same level of the eighties of last century (and it is increasing). Italy is a clear case of politics failure, a failure lasting 20 years (the so-called “Seconda Repubblica”). A chronic inability of Italian policy makers in matching structural institutional, social and economic issues made more compelling by radical changes in the state of the world of the last decades.
Government size.
What happened in the last 30 years in most capitalist developed countries is, on average, an up and down of government size, with an underlying smoothed positive trend. Let take the period 1980-2012 and consider a representative group of 20 developed countries (15 European): Austria, Belgium, Denmark, Finland, France, Germany, Greece, Iceland, Ireland, Netherlands, Norway, Portugal, Spain, Great Britain, Usa, Canada, Japan, Australia. For these 20 countries, as a proxy for government size I used the general government total expenditure in percent of Gdp, drawing figures from the Imf Weo Database (April 2013). As mentioned before, aggregate measures points out an inherently stable share of government expenditure, even if dynamics shows that upswings alternate with changes in the opposite direction. The median value (the corresponding average value is reported in brackets) for this measure of government size is 43.8 percent (42.7) in 1980, 46.1 % (46.8) in 1991, 44.8 % (44.0) in 2001, 46.3 % (47.4) in 2012 – see Graph 1.
As usual, the choice of starting and ending points is sensible and could bias the aggregate picture. Unfortunately, Imf Weo database does not provide a symmetrical starting point for this set of countries. Six countries over 20 have no complete data entries for the first decade (1980-90). Data begin in 1991 for Germany, in 1995 for Netherlands, in 1988 for Italy, Australia and Austria, and in 1987 for Portugal. Also the choice of ending point is tricky, because the interval 1980-2012 includes the years of Great Recessions, when fiscal stimulus was more or less intensively used determining a situation where an increase in government expenditure together with declining output growth rates it is observed. In any case, I am forced to take the year 2012 as a terminal point, unless one use forecasts for years following 2012 (Imf provides estimates till to 2018). Then, in the interval 1980 (…)-2012 a smaller fraction of these countries (7 or 5 countries depending on initial year chosen) shows a visible reduction in general government total expenditure as a share of Gdp: Belgium (from 56.5 to 54.8%, starting in 1980), Canada (from 43.9 to 41%, starting in 1980), Germany (from 46.1 to 45%, starting in 1991), Ireland (from 47.8 to 41.6%, starting in 1980), Netherlands (from 56.4 to 50.1%, starting in 1995), Portugal (from 51.3 to 45.6, starting in 1987), and Sweden (from 60.3 to 50.1, starting in 1980). 
Note that Netherlands and Portugal are two strong cases where initial conditions matter, because if we slightly change the initial year (1996 instead of 1995 for Netherlands, 1988 instead of 1987 for Portugal), the aforementioned pattern reverses (increasing not decreasing government size). Note also that, despite this declining pattern, government size persists over 50 percent of Gdp in three of these seven countries. Finally, note that this subset of countries where government size is decreasing does not show any sign of a worst macroeconomic performance with respect to the other countries where government size is increasing.
In the remaining 13 countries, government size is slightly increasing or constant (Austria, Italy, Great Britain, Norway), or it is noticeably increasing (Australia, Usa, Japan, Spain, Iceland, Greece, Finland, Denmark). 
Government Size and Growth
One could go further in this analysis arguing about the relationship between government size and growth.
It could be too easy to compare macroeconomic performance of Sweden, a country where government size has been reduced of 10 percentage points in the interval 1980-2012, with that of Greece, where government size has been increased of over 20 % points in the same period.
Generally, data strongly show that there is a negative correlation between Gdp rate of growth (AYG) and general government total expenditure in percent of Gdp (AGS). Of course, (statistical) correlation does not mean causation and thus one is not allowed to conclude that an increase in government size determines a reduction in growth – it could be possible also the reverse: a reduction in growth causes an increase in government size (as long as anti-cyclical fiscal policy is actively utilized, public spending increases when output declines).
In any case, if we compare this statistical relationship for the subset of countries where government size is increasing with that of countries where government size is decreasing, we find that the negative correlation is stronger (the trend line is steeper) for the first subset of countries. 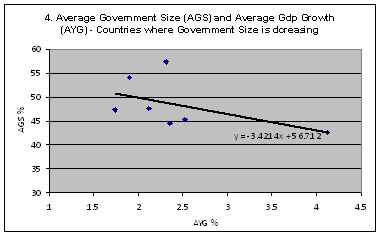
 Conclusions
There is not such a thing like a retreat of the state in the most developed capitalistic countries. If we consider the years between 1980 and 2012, there is no trend in aggregate data for government size, even if we observe cycles of upswings alternating with movements in the opposite direction. The last change leaved the government size for a significative sample of capitalistic developed countries close, in average, to what this share was in the eighties.
